Generational Differences in Attitudes Toward Obesity: Analyzing Dislike, Empathy, and Attraction Across Generations Z and Jones

Abstract

The current research explored whether generational effects exist in the attitudes towards overweight/obese people regarding the following: dislike, empathy, and attraction to them. The sample was made up of a Generation Z and a Generation Jones sample, and descriptive statistics, normality tests, and Mann-Whitney U tests were used. The findings did not indicate any significant effects between the three variables across the two generations, even though slight trends indicated that Generation Jones exhibited marginally higher levels of dislike and empathy. From the findings, it is implied that generational factors do not notably influence attitude towards obesity, hence necessitating further research to ascertain other plausible cultural or environmental factors influencing attitude.

Background

Attitudes are changeable variables on the societal scale and personal. The interplay between factors such as different cultures, socioeconomic status, gender, environment, and the generational gap can change and form new attitudes. This study, particularly, is going to investigate the differences in attitudes and stigmatisation towards obesity between Gen Z (1997-2012) and Gen Jones (1954-1965). Results will bring insight into the current state of the attitudes towards obese people in society. Showing the trajectory of the trend. Based on the result, it will be possible to assume the future of the attitudes towards obesity. Additionally, generational differences could highlight pivotal aspects of social and cultural behaviour which shape the attitudes. Such insight would be beneficial for further improving people’s attitudes.

There is plenty of evidence of prejudice against obese people dating from a 1955 study by Keys, which presented attitudes of 1000 people on overweight people being widely characterised as socially handicapped, morally and emotionally impaired (The original source annotated that the term “fat people” was used due to not specified a particular BMI value in their research. This indicates that their survey did not include attitudes specifically related to the medical condition of obesity, which may have influenced how participants viewed individuals classified under that term. Essentially, the choice of wording reflects a broader or more general perspective without any malicious intentions). The majority of the research during the Gen Jones era associated overweight and obese people with a variety of negative terms. For instance, several survey research showed common negative stereotypes around physical appearance, characterising obese people as unappealing (Harris et al., 1982) and aesthetically displeasing (Wooley & Wooley, 1979).

Moreover, Milman, in his comprehensive analysis of multi-case studies and autobiographical accounts (1980), depicted a common view of that time of obese women as unfeminine, sexually repulsive or a deviant sexual object. The stigmatisation of overweight and obese people was apparent in all spheres of life. For example, in the workplace, they faced reoccurring discrimination (Rothblum et al., 1990), which could even result in them being deprived of promotion to a higher position (Larkin & Pines, 1979).

Clearly, an overwhelming amount of evidence illustrates a prejudiced society’s attitude towards obese people during Gen Jones’s time. In order to see if that trend proceeded to Gen Z, more modern papers should be viewed.

Generation Z was the first one to be born during the mass spread and availability of the Internet, which led to Gen Z engaging in International online communication from an early age. Such exposure to a global multicultural online community and access to diverse information helped Gen Z to develop a more inclusive approach to social interactions. (Chen & Ha, 2023). Tech-savvy Gen Z is more careful with consumed information. Social media

platforms like Instagram and TikTok have played a pivotal role in promoting diverse body representation and challenging traditional beauty standards. Their engagement with body- positive content on social media led to the development of positive body image, better emotional well-being and body-positive movement in recent years (Cohen et al., 2020). Nevertheless, such a positive attitude towards inclusive body image does not contribute to the issue of obesity. A recent study on the correlation between Optimism and healthy, Overweight and obese Generation Z reported that there was no significant relationship between BMI and optimism (r = -.003), as well as no significant difference between obese groups for optimism and healthy, overweight (p = .55), (Tucker, 2020). Concomitantly, acceptance of diverse body shapes does not mean ignoring health issues like obesity. In fact, Gen Z exhibits concern about global environmental issues and focuses on personal health, mental well-being and ethical behaviour (Lendvai, 2022). This suggests that a positive attitude about the body image of Gen Z is a healthy approach. This could be supported with a thematic analysis of 1918 public videos tagged #GenZ on TikTok social media. Generational identity is represented by their sense of collectiveness, self-awareness and reflectiveness, and inclusivity in terms of body image and social belonging (Stahl & Literat, 2022).

Rationale and Hypothesis

There are no direct studies on what kind of attributes Generation Z exhibits towards obese people and whether they engage in discriminative behaviour towards overweight people. This report aims to fill that gap by researching Gen Z attitudes towards obese people and comparing it with the same data collected from Generation Jones. It is important to research generational differences in addressing societal issues like discrimination based on body size, especially since obesity remains a public health concern. Highlighting the differences could not only help in reducing stigma effectively under generational values, but it could also inform future public health campaigns.

Research Question: Is there a difference in attitudes towards obese people between Gen Z and Gen Jones?

Dislike Hypothesis: Generation Z will exhibit less dislike towards obese individuals compared to Generation Jones.

Empathy Hypothesis: Generation Z will display higher empathy levels towards obese individuals than Generation Jones.

Attraction Hypothesis: Generation Z will hold more neutral or positive attitudes regarding attraction towards obese individuals compared to Generation Jones.

Method

Participants

The study included 20 participants divided into two generational groups: Generation Z (10 participants) and Generation Jones (10 participants).

Age

The mean age of participants was calculated for each group. For Generation Z, the ages ranged from 18 to 26 years, while for Generation Jones, the ages ranged from 59 to 69 years. Descriptive statistics, including mean and standard deviation for age, were computed to summarise the demographic characteristics.

Gender

The gender distribution was recorded for both groups, with frequencies calculated to provide an overview of participant demographics.

Recruitment

A total number of participants were collected using a convenience sampling method. For Generation Z participants, the sister of the researcher, a freshman student at the University of Budapest Art, was asked to help. She shared the questionnaires with her friends and classmates. Generation Jones participants were recruited via the researcher’s mother, who is currently working in an educational institution, by distributing questionnaires among colleagues.

Inclusion/Exclusion Criteria

Participants were included in the study based on their age, aligning with the defined generational ranges: 18–26 years for Generation Z and 59–69 years for Generation Jones. Responses outside these age ranges were excluded to maintain consistency in generational comparison.
Design

The study employed a between-subjects design, with participants categorised into two independent groups based on their age: Generation Z (18–26 years) and Generation Jones (59–69 years). The independent variable was the age group, while the dependent variables were participants’ attitudes across the three dimensions of dislike, empathy, and attraction.
Materials

The study utilised a questionnaire designed to assess attitudes toward overweight and obese individuals. The questionnaire comprised 12 items divided into three categories corresponding to the dependent variables: dislike, empathy, and attraction.

Dislike (Questions 1–4): The following questions reveal the negative attitude of participants in this section, such as not wanting to hire overweight people or linking overweight people with certain characteristics.

Example Question: “I would never hire an overweight person if I had my own business.”

Empathy (Questions 5–8): These items scored the respondent’s ability to take the perspective of the overweight person and his or her response to unsolicited counsel.

Example Question: “It’s okay to give weight loss advice to obese/overweight people even if you don’t know them very well.”

Attraction (Questions 9–12): This section explored participants’ perceptions of attraction to overweight people.

Example Question: “Overweight people are sexually repulsive.”

Participants responded to all items on a 5-point Likert scale ranging from 1 (Strongly Agree) to 5 (Strongly Disagree). Reverse-scored items were adjusted before analysis to ensure consistency in interpretation. Using the Qualtrics platform enabled the collection of responses from participants across two distinct age groups and ensured anonymity in data collection. The questionnaire was made available in both English and Serbian to accommodate the linguistic needs of the participants. However, the Serbian translation was omitted from the appendix for brevity and relevance to the expected readership. The Participant Information Sheet, Consent Form, Questionnaire, and Debriefing Page are in Appendix A.
Ethics

The study was conducted under regulations that ensured participants’ safety. All respondents received an information sheet explaining the purpose of the study, the procedure, and their right to withdraw before submitting the data. Informed consent was obtained electronically.

Data collection was anonymous, with responses stored on a password-protected device. All data will be destroyed on completion of the module. The online questionnaire, via Qualtrics, thus ensured privacy and convenience. Permission was obtained from the University of Essex Online Ethics Committee. The questionnaire was available in both English and Serbian so that the language requirements were taken into account. The risk was minor, as participants reflected upon their attitudes by not disclosing their personal information. Documentation (Consent Form, Information Sheet, and Debriefing Page: Appendix A).

Results

Descriptive Statistics

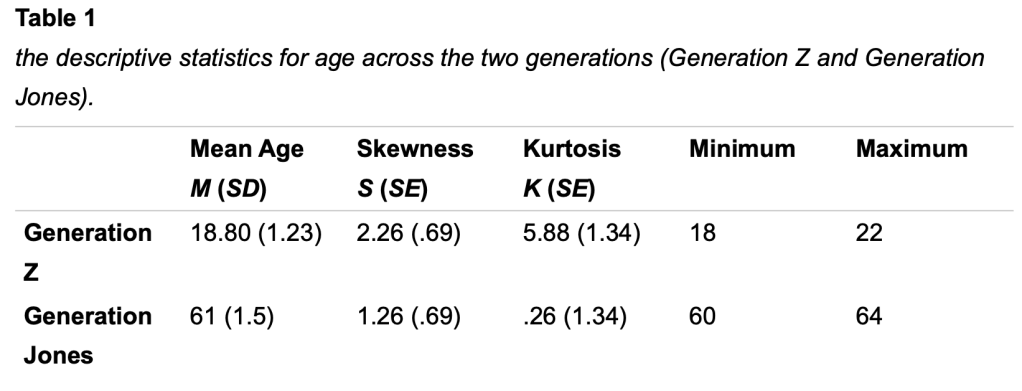
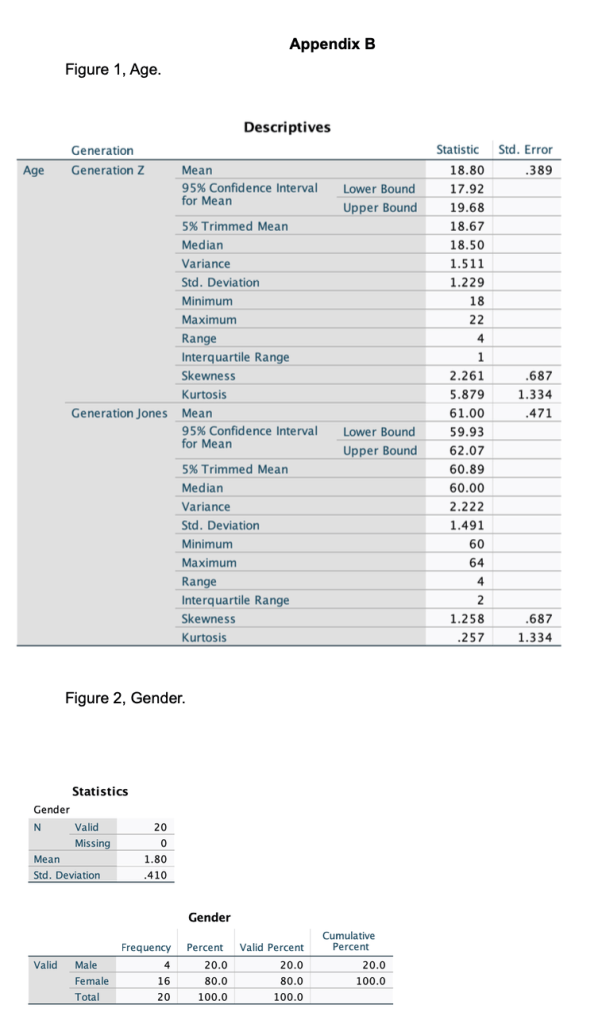
the descriptive statistics for participants’ ages across the two generational groups, Generation Z and Generation Jones, are presented in Table 1. These include measures of central tendency (mean) and spread (standard deviation, skewness, kurtosis, and range). Generation Z participants had a mean age of 18.80 years (SD = 1.23), with ages ranging from 18 to 22. Skewness (S = 2.26, SE = .69) and kurtosis (K = 5.88, SE = 1.34) indicate a slight positive skew and leptokurtic distribution, reflecting a cluster of younger participants close to the lower age limit. Generation Jones participants had a mean age of 61.00 years (SD = 1.50), with ages ranging from 60 to 64. Skewness (S = 1.26, SE = .69) and kurtosis (K = .26, SE = 1.34) suggest a relatively symmetric and normal age distribution for this group.

The descriptive statistics for participants’ gender are presented below. The sample comprised 20 participants, with 16 females (80%) and 4 males (20%). This distribution highlights a predominance of female participants across the sample, which may influence the interpretation of gender-related findings. Figures illustrating the demographic breakdown, including age (Figure 1) and gender (Figure 2), are included in Appendix B.

Normality Tests

Dependent Dislike

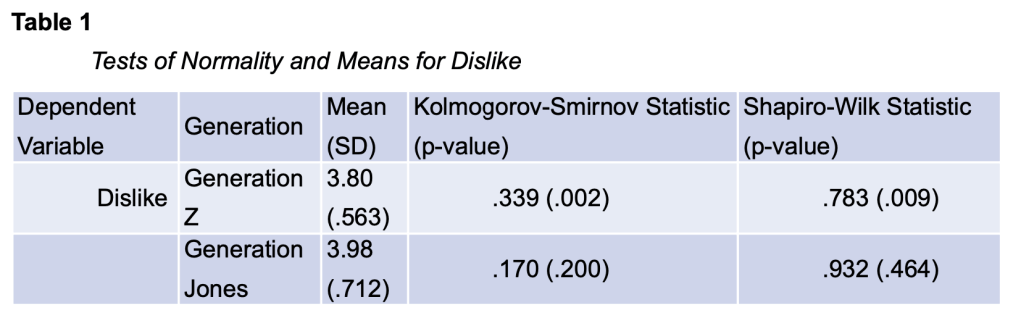
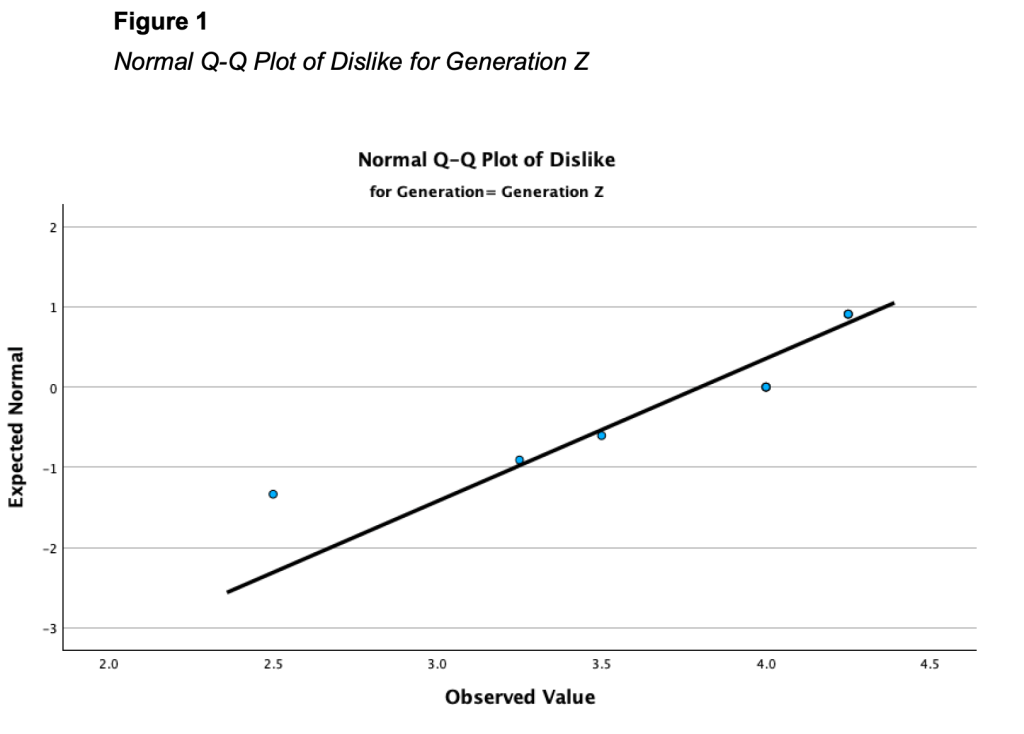
The results for the dependent variable “Dislike” are presented below in Table 1, highlighting the differences between Generation Z and Generation Jones. Descriptive statistics revealed that Generation Z reported a mean dislike score of 3.80 (SD = 0.56), while Generation Jones had a slightly higher mean score of 3.98 (SD = 0.71). To assess the normality of the data, Shapiro-Wilk tests were conducted separately for each generation. As shown in Table 1, the Shapiro-Wilk test for Generation Z, the results indicated a violation of normality (p = 0.009), suggesting the data are not normally distributed. However, the data for Generation Jones met the assumption of normality (p = 0.464). Supporting these findings, visual inspections of Q-Q plots (Figure 1) and detrended Q-Q plots (Appendix C) showed deviations from the normal distribution for Generation Z, while the distribution for Generation

Jones appeared more aligned with normality. Boxplots illustrated a slightly wider range of scores for Generation Jones, reflecting greater variability compared to Generation Z (Figure 2). These findings suggest a generational difference in attitudes towards obese individuals, with Generation Jones exhibiting marginally stronger negative attitudes, as reflected in their higher mean dislike score.

Dependent Empathy

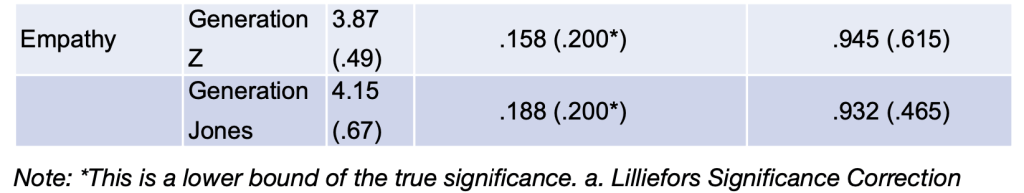
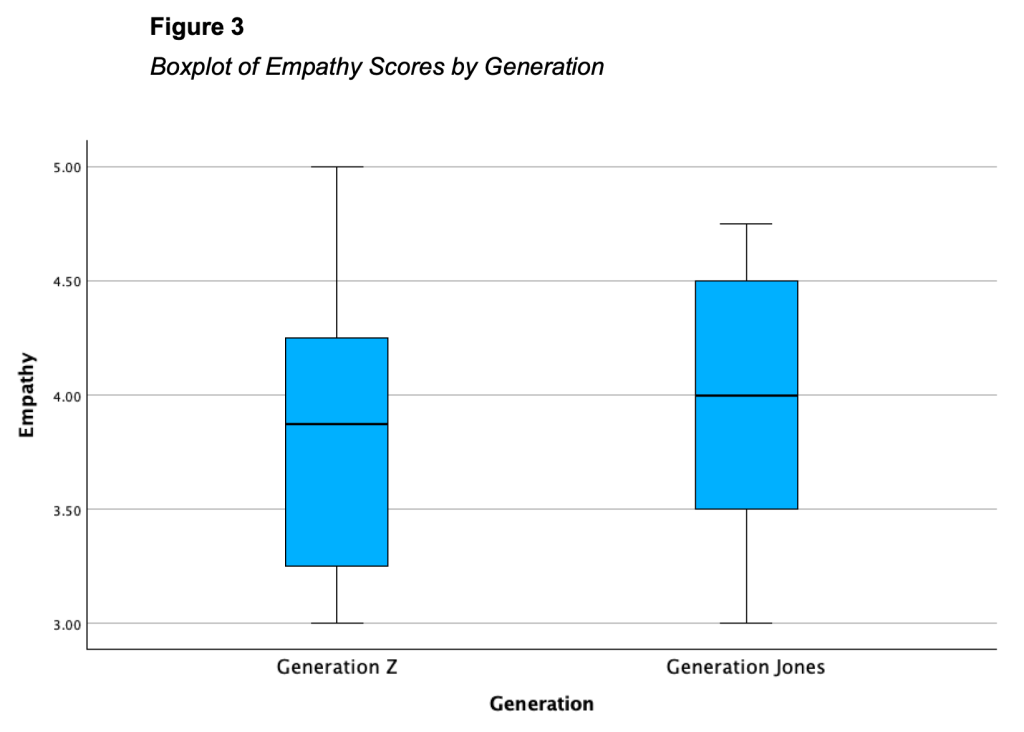
The results for the dependent variable “Empathy” are presented below in Table 1, highlighting the differences between Generation Z and Generation Jones. Descriptive statistics indicated that Generation Z reported a mean empathy score of 3.87 (SD = 0.49), while Generation Jones had a slightly higher mean score of 4.15 (SD = 0.67). To evaluate the normality of the data, Shapiro-Wilk tests were performed separately for each generation. Both Generation Z (p = 0.615) and Generation Jones (p = 0.465) satisfied the assumption of normality, indicating that the empathy scores for both generational groups followed a normal distribution.

Visual analyses provided additional confirmation. Q-Q plots (Figure 1, Figure 2) and detrended Q-Q plots (Appendix D) for both generations revealed that data points closely aligned with the expected normal line, supporting the normality of the distributions. Additionally, boxplots (Figure 3) illustrated a slightly wider range of empathy scores for Generation Jones, reflecting greater variability compared to Generation Z. These results suggest generational differences in empathy, with Generation Jones exhibiting marginally higher empathy levels overall.

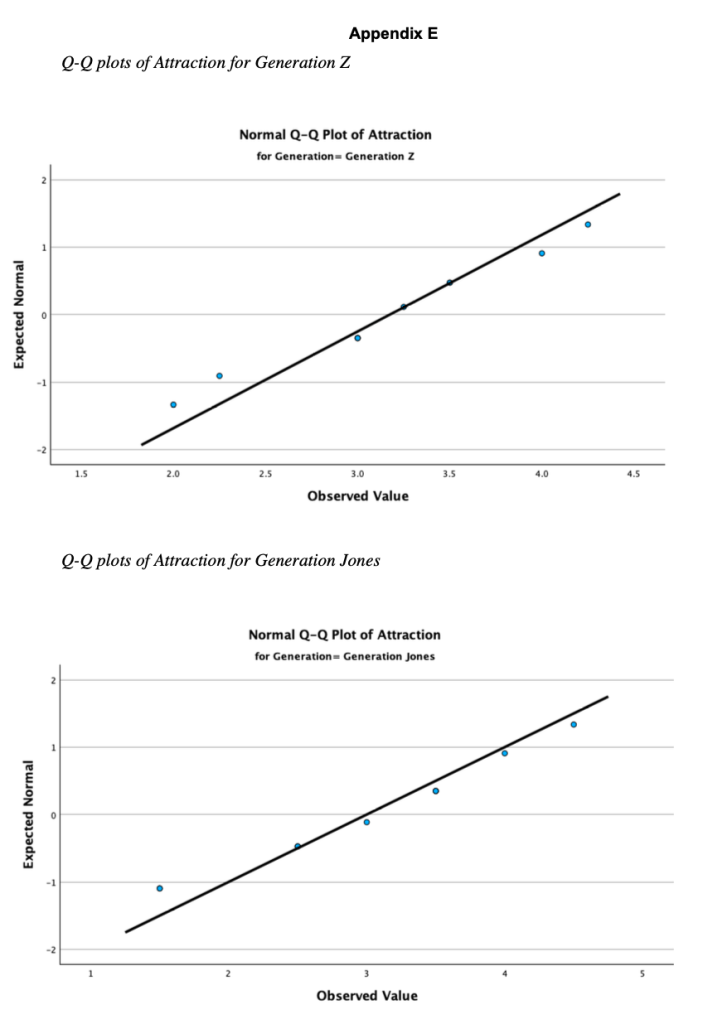
Dependent Attraction

For the variable Attraction, the same statistical procedures were applied as for the previous variables. Shapiro-Wilk tests indicated that the data met the assumption of normality for both Generation Z (p = .724) and Generation Jones (p = .498). Descriptive statistics revealed that Generation Z had a mean attraction score of 4.10 (SD = .55), while Generation Jones reported a mean score of 4.20 (SD = .62). Visual inspections of Q-Q plots and boxplots (Appendix E) supported these findings, showing minimal deviations from normality and comparable variability between the two groups.

Statistical Test Justification

Due to the violation of normality for certain variables, as evidenced by the Shapiro- Wilk test results (e.g., Dislike: p = .009 for Generation Z), non-parametric tests were used for further analyses. Specifically, the Mann-Whitney U test was employed to compare group differences across the dependent variables: Dislike, Empathy, and Attractiveness. This approach is appropriate for small sample sizes and non-normally distributed data. Hypothesis Testing

Mann-Whitney U Test: Dislike

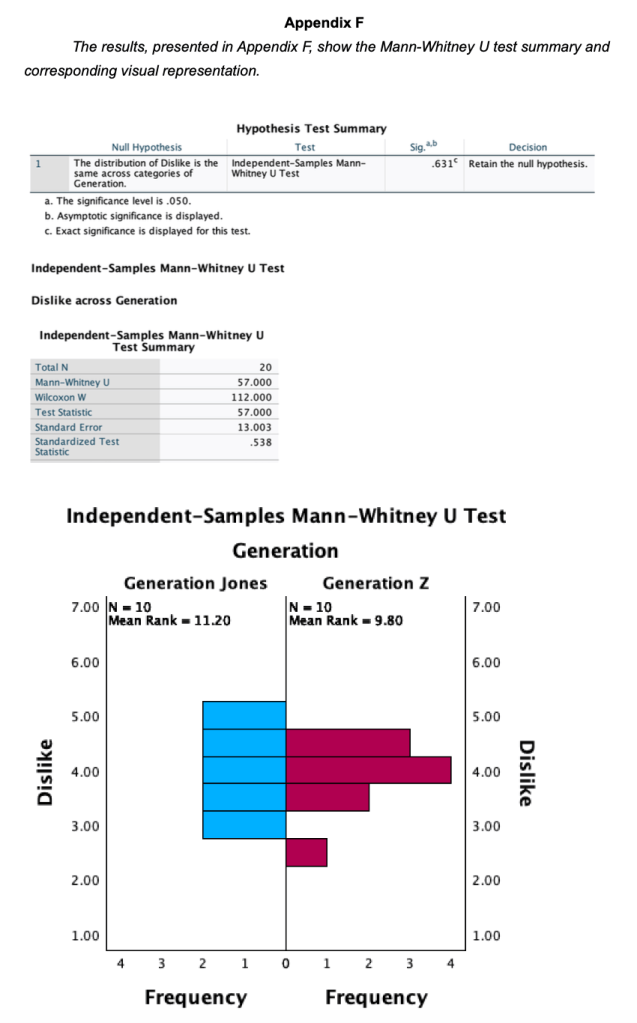
To compare the scores of Dislike between Generation Z and Generation Jones, a Mann-Whitney U test was conducted due to the violation of normality in Generation Z’s data.

The results (Appendix F) indicated no significant difference in the distribution of Dislike scores across the two generations, U = 57.00, p = .631. The mean rank for Generation Z was 9.80, while for Generation Jones, it was slightly higher at 11.20. As the p-value exceeded the .05 threshold, the null hypothesis of no difference between the groups was retained, suggesting that generational differences in Dislike are not statistically significant in this sample.

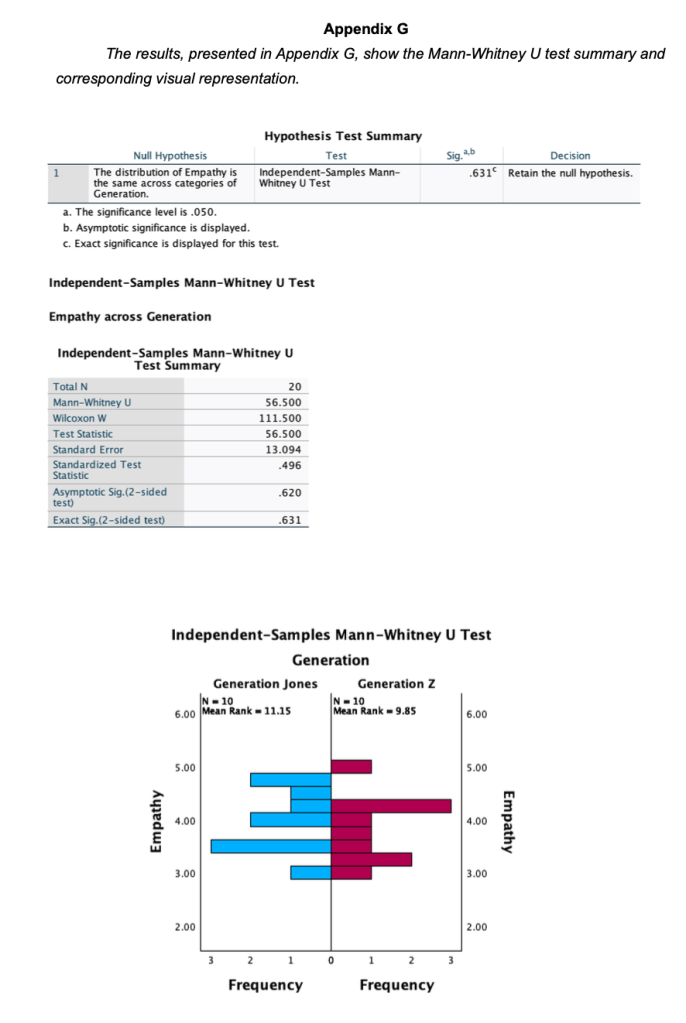
Mann-Whitney U Test: Empathy

The data shows that the Mann-Whitney U test was used to compare the distributions of empathy across Generation Jones and Generation Z. As Shown in Appendix G, results indicated no significant difference between the groups (U = 56.5, p = .631), suggesting that both generations exhibit similar levels of empathy. The test outcomes, alongside visual representations of rank distributions, support the conclusion that generational membership does not notably impact empathy scores in this sample.

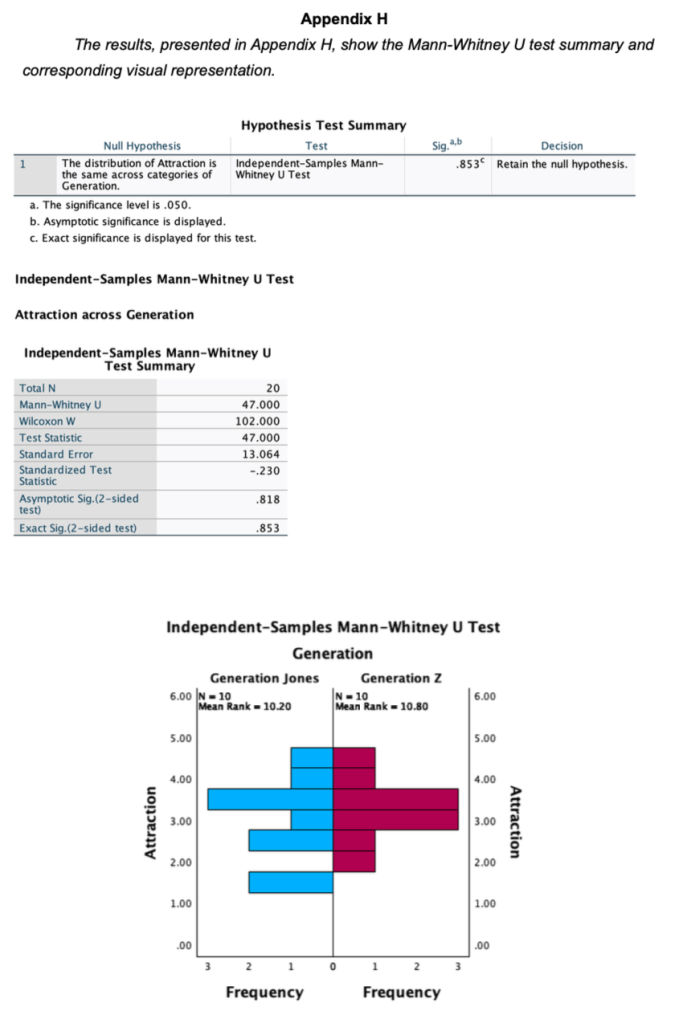
Mann-Whitney U Test: Attraction

The analysis of attraction scores between Generation Z and Generation Jones was conducted using the Mann-Whitney U test to compare distributions across the two groups. The results (Appendix H) showed no statistically significant difference in attraction scores between the two generations (U = 47.000, p = 0.853). The mean ranks were nearly identical, with Generation Z scoring a mean rank of 10.80 and Generation Jones scoring 10.20. This indicates that the perceptions of attraction are consistent across both generational cohorts, supporting the null hypothesis that the distributions are the same.

Discussion

Overview

The current study targets generational differences in weight-related stigmatisation, measured by three variables: Dislike, Empathy, and Attraction. While these results add significantly to current knowledge, no statistical differences between the generations of Z and Jones were shown in this analysis for any of the dependent variables.
Comparison with Research

Where the research design had postulated some generational differences in the three dependent variables, this had not been supported by the results. The Mann-Whitney U tests conducted on Dislike, Empathy, and Attraction all had p-values greater than the level of significance: p >.05. This supports the notion of relatively similar attitudes towards overweight and obese individuals in the two generations studied here. Importantly, even when descriptive statistics showed small differences in mean scores-favouring Generation Jones on Empathy and favouring Generation Z on Attraction difference failed to reach a level of statistical significance.
Comparison with Published Results

These findings are consistent with limited previous studies that indicate weight- related attitudes do not vary sharply across generational cohorts. For instance, studies by Keys (1955) and Harris et al. (1982) emphasized the dominant negative stereotypes against obesity within past generations, but this present study suggests that some such attitudes continue across the line of generations. Interestingly, modern findings, such as those by Cohen et al. (2020) and Stahl & Literat (2022), have shown Generation Z’s increased exposure to body-positive movements, yet this shift may not have translated to measurable generational differences in stigma levels. The failure to detect significant effects in the present study could be attributed to the small sample size, which may not have been sufficient to capture subtle trends or differences in attitudes influenced by cultural or social dynamics.
Implications for Future Research

Results have highlighted that this issue needs further investigation with larger and more diverse samples. Further research should, therefore, consider variables such as social status, cultural backgrounds, and personal experiences related to issues of weight since these may crucially influence attitudes. Additionally, longitudinal studies, building on findings such as those by Lendvai et al. (2022) on Generation Z’s health consciousness, could explore whether attitudes evolve over time in generational cohorts.
Practical Implications

From a practical point of view, the results of the present study imply that interventions aimed at weight-related stigma would not have to vary across age groups but could be generalised across generations. This may reduce the complexity of devising educational campaigns and public health initiatives targeting weight bias.

Strengths and Weaknesses

This study is mainly strengthened by a focus on generational comparisons rather than underexplored areas in the context of weight stigma research. Multiple dependent variables add depth to the analysis. There were several limitations to this study. Most likely, the small sample size reduced statistical power and increased the risk of Type II errors. Additionally, the imbalance in the sample-80% being female and the limited age brackets within each generation mean that generalisation may be limited. Future studies should, therefore, strive for a balance and representation to avoid such problems.

Appendix A

Appendix A: Information Sheet, Consent Form, Full Questionnaire, and Debriefing Page.

References

Chen, P., & Ha, L. (2023). Gen Z’s social media use and global communication. Online Media and Global Communication, 0. https://doi.org/10.1515/omgc-2023-2006

Cohen, R., Newton-John, T., & Slater, A. (2021). The case for body positivity on social media: Perspectives on current advances and future directions. Journal of Health Psychology, 26(13), 2365-2373. https://doi.org/10.1177/1359105320912450

Harris, M. B., Harris, R. J., & Bochner, S. (1982). Fat, four-eyed and female: Stereotypes of obesity, glasses and gender. Journal of Applied Social Psychology, 6, 503-516.

Keys, A. (1955). Obesity and heart disease. Journal of Chronic Diseases, 1, 456-460. Larkin, J. E., & Pines, H. A. (1979). No fat persons need apply. Sociology of Work and

Occupations, 6, 312-327.
Lendvai, M., Kovács, I., Balázs, B., & Beke, J. (2022). Health and environment conscious

consumer attitudes: Generation Z segment personas according to the LOHAS model.

Social Sciences. https://doi.org/10.3390/socsci11070269
Millman, M. (1980). Such a pretty face: Being fat in America. New York: Norton. Rothblum, E., Brand, P., Miller, C., & Oetjen, H. (1990). The relationship between obesity,

employment discrimination, and employment-related victimization. Journal of Vocational

Behavior, 37, 251-266. https://doi.org/10.1016/0001-8791(90)90044-3
Stahl, C., & Literat, I. (2022). #GenZ on TikTok: The collective online self-portrait of the

social media generation. Journal of Youth Studies, 26, 925-946. https://doi.org/

10.1080/13676261.2022.2053671
Tucker, A. (2020). The relationship between optimism and BMI in Generation Z – An

exploratory investigation. Honors College Theses, 463. https://

digitalcommons.georgiasouthern.edu/honors-theses/463
Wooley, S. C., & Wooley, O. W. (1979). Obesity and women—I. A closer look at the facts.

Women’s Studies International Quarterly, 2, 69-79.

What is the evidence that supports the idea that measures of individual differences can predict human behaviour?

This discussion will critically examine the evidence of the predictive power of individual differences to predict behaviours. 

To begin with, research has shown consistently that personality traits, particularly those from the Five-Factor Model (e.g., conscientiousness, neuroticism), are useful in predicting behaviour. For example, conscientiousness is linked to job performance, academic success, and better care of overall health, while neuroticism is associated with negative mental health outcomes (Maltby et al., 2023). Moreover, trait theorists claim that finding out the source traits of a person by testing to which extent a person possesses surface traits, will allow them to predict an individual’s behaviour. They view traits as stable characteristics, which allows future behaviour prediction (Cervone & Pervin, 2013). 

The major critique of using personality traits to predict behaviour is the context dependency of behaviour. For example, Geukes et al. (2017) show that personality traits can predict behaviour to some extent, but it has limitations due to significant variability depending on the context. Similarly, Lievens et al. (2018) highlight the importance of recognising substantial intraindividual variability in behaviour across different situations and for the most accurate result, both between and within-person trait variability should be measured. 

However, individual differences observed in behaviour are not merely psychological constructs but have a physiological basis. For instance, neuroimaging studies indicate that structural differences in the brain are linked to behavioural and cognitive abilities differences. Particularly, MRI studies showed that inter-individual variability in cognitive functions like memory, motor control, perception, and ability to introspect can be predicted from the structure of grey and white matter. Researchers stated that the differences in strengths of white matter tract connectivity allow higher or lower speed of information transfer across the brain’s regions, which can be linked with inter-individual differences in human behaviour. This has been studied using the Diffusion Tensor Imaging technique. Moreover, after conducting experiments, researchers stated that inter-individual variability in the ability to correct and quickly choose the response during visual stimulus tests correlates with the grey matter density of the pre-supplementary motor area. (Kanai & Rees, 2011).

On the other hand, critics argue that the relationship between brain structure and behaviour is more complex due to non-linear and multifunctional brain structure. One of the examples is the brain’s plasticity ability, which lets behavioural differences shape and reshape brain structure, at the same time brain structure can also influence behaviour (Pessoa, 2014).

In conclusion, the evidence suggests that individual differences, such as personality traits and brain structure, play a significant role in predicting behaviour. For example, the Five-Factor Model has been shown to accurately predict future important life outcomes such as job performance, and overall health. Additionally, neuroimaging studies provided a physiological basis, linking structural brain differences to behavioural and cognitive abilities variations.

However, the complexity of the non-linear nature of the brain and context dependency highlights the importance of developing an approach which will incorporate both psychological and physiological factors, when measuring individual differences. 

Reference List

Cervone D. & Pervin L. A. (2013). Personality: theory and research (Twelfth). Wiley.

Geukes, K., Nestler, S., Hutteman, R., Küfner, A., & Back, M. (2017). Trait personality and state variability: Predicting individual differences in within- and cross-context fluctuations in affect, self-evaluations, and behavior in everyday life. Journal of Research in Personality, 69, 124-138. https://doi.org/10.1016/J.JRP.2016.06.003.

Kanai, R., Rees, G. (2011). The structural basis of inter-individual differences in human behaviour and cognition. Nature Reviews Neuroscience, 12, 231–242 (2011). https://shorturl.at/UsEKc

Lievens, F., Lang, J., Fruyt, F., Corstjens, J., Vijver, M., & Bledow, R. (2018). The Predictive Power of People’s Intraindividual Variability Across Situations: Implementing Whole Trait Theory in Assessment. Journal of Applied Psychology, 103, 753–771. https://doi.org/10.1037/apl0000280.

Maltby, J., Day, L., & Macaskill, A. (2023). Personality, Individual Differences (5th ed.). Pearson International Content. https://essexonline.vitalsource.com/books/9781292726960

Pessoa, L. (2014). Understanding brain networks and brain organization. Physics of Life Reviews, 11(3), 400-435. https://doi.org/10.1016/j.plrev.2014.03.005

Does violent pornography influence the formation of violent attitudes towards women?

The purpose of this Memo is to show the correlation between violent pornography consumption and the formation of attitudes towards sexual violence against women.

Context

Sexual violence towards women is a big problem nowadays, according to WHO (2021), 1 in 3 women globally has experienced sexual violence in their lifetime. Additionally in the latest big data analysis of 4009 heterosexual scenes from Pornhub and Xvideos researchers found that at least in 45% of videos there are acts of physical violence and in 97% of them, women were the target of sexual violence. (Fritz et al 2020)

Task Segment

To understand does violent pornography have a harmful effect on society, first, the memo will provide data from different resources worldwide on violent pornography consumption. Additionally, it will be important to present statistics on sexual crimes. Then will be discussed attitude formation process in a given case and finally will be drawn a conclusion based on the mentioned data and theories.

Discussion Segment

According to pornhub.com (2019) statistics, the website was visited 42 billion times worldwide, which on average is 115 million visits per day. Fritz et al., (2020) analysed 4009 scenes and found that 45.1% contains at least one act of physical aggression towards women and 10.1% of verbal violence. When only 3.7% of violent acts were targeting men. Additionally, victims’ reactions towards violence mostly were neutral or positive. Previous research was shown similar data that women are targets of aggression in most cases – 84.7% (Barron and Kimmel, 2000). 

The study on sexual harassment and assault, reports that 81% of the sample of 996 women experienced sexual assault or harassment during their lifetime (Kearl, H. 2018). Moreover, 1in 5 women in the USA experienced completed or attempted rape in their lifetime, according to NISVS (Smith, S. 2018). 

The significance of pornography in today’s life can not be denied. In the last decade, it has been studied more and important results were found. One of the notable research is a meta-analysis by Wright et al.(2016), which examined 22 research from 7 countries. The results proved the correlation between violent pornography consumption and attitudes to sexual violence against women. Moreover, the data claims that individuals who frequently use pornography are more likely to have negative attitudes towards women and to act out sexually violent behaviour. 

This can be explained by the fact that frequently observed sexual behaviour strengthens the attitude towards such behaviour. Also, an important factor in strengthening the attitude is the victim’s positive reaction towards sexual violence in pornography. For instance, Donnerstein and Berkowitz (1981) proved that such a reaction justifies aggression and diminishes the importance of the issue. This leads an observer to learn a new sexual behaviour pattern where an aggressive act leads to positive feedback from a woman. What is more, the objectification of body parts as sexual objects enables the process of “dehumanising” a person, which makes violence against them much more acceptable (Wilson, 2012). Cultural normalisation of sexual violence leads to reinforcement of the attitude, as described by the utilitarian function of attitudes.

It is also important to take into consideration the attention factor. Objects towards which people have strong attitudes draw attention. Which helps to categorise and leads to the automatisation of a cognitive process. Less energy is consumed by the decision-making process when people bring attention to the object with an already-formed strong attitude (Cooper, J., et al. 2016). What is interesting here to mention, is that in the latest research in the neurology area, scientists found out that grey matter shrinks as the result of often usage of pornography. Frequent abuse of the reward system of the brain rewires it, which affects decision-making ability (Kühn and Gallinat, 2014).

Attention factors and negatively affected decision-making ability coincide. Making a person come back to get that dopamine release again by using pornography more and more at any stressful moment. Though, to get the same feeling a person has to watch more extreme content because the regular won’t cause such excitement. So, the level of violence increases. These factors enhance the effect of strengthening the attitude towards violence against women. Because a person gets positive feedback from everywhere, society approves and shares this interest, women in videos show a positive reaction, brain release dopamine. All those factors signalled that this is an approved scenario. 

Another important issue in negative attitude formation is – with exposure to sexually aggressive pornography, female viewers develop acceptance of victimisation over time (Bonino, 2006). Thus normalising sexual aggression as an acceptable social behaviour forms an attitude towards male partners as they must exhibit aggressiveness during sexual acts. Which only reinforces sexual aggression in male behaviour, through positive feedback. 

Closing Segment

From the provided data on pornography consumption, we can conclude that it has a permanent place in the lives of many people and it is important to be aware of its effect. As in stated earlier arguments, it is clear that exposure to sexual, violent content influence on the formation of attitudes towards women and great exposure to it leads to a bigger likelihood of engaging in sexually violent behaviour against women. There is plenty of evidence of that in older research like in Donnerstein’s (1984) experiment where it was confirmed that after exposure men expressed that they are more likely to engage in violent behaviour; and in new research like in Wright’s (2011) meta-analysis. This leads to the conclusion, violent pornography has a great impact on the mind and forms negative attitudes towards women. What is more, frequent usage negatively influences decision-making ability and even can cause an addictive type of behaviour. 

These factors are enough to be concerned about the accessibility of such material and it raises a question – “Should it be regulated on some level and how it can be organised?”

References

Social Psychology

Leave a comment

What is the danger of normalising exposure to violence in media?

Social psychology is the scientific study of human’s behaviour, thoughts, feelings within the social context. Studies of this nature can help understand what effect has the social world on individuals and groups, help predict social behaviour and change it. This requires a strong scientific basis to not harm anyone. That’s why social psychologists use scientific methods. First, they build up the theory based on found evidence. Then, scientists propose and test a hypothesis by actual interaction with people. After they’ve collected enough data, psychologists evaluate the theory. By the conclusion of it, they either approve the theory or disapprove it and start the revision (Bernstein, 2016). No doubt this is the right way to study human’s mental processes and behaviour, especially when data of the research can help resolve major social issues, such as aggressive behaviour. There were conducted numerous studies on that topic, but this work will specifically focus on 2 famous social psychology studies. 

The first study was conducted by Donnerstein in which he investigated the connection between violent pornography and aggression towards women. Donnerstein created a laboratory experiment where male participants would offer to watch an erotic non-violent film, aggressive pornography video (2 types: with victim positive reaction and negative reaction) and non-sexual aggressive film with the same amount of violence toward a woman. Afterwards, subjects get an option to aggress against a female confederate by administrating an electric shock. Additionally, participants after the experiment would fill in self-reports where they give answers to related questions (1984). The series of studies showed that light pornography doesn’t increase aggression towards women (Donnerstein and Barrett, 1978). Mosher (1971). The meanwhile non-sexual aggressive film increased aggressive attitudes in pre-angered and non-pre-angered men towards females. Malamuth and Check (1981). The biggest increase showed subjects watched a violent sexual video. What is more, a victim positive reaction to violence is a crucial aspect, as it is justifying aggression and diminish the importance of the issue. Donnerstein and Berkowitz (1981). That data has been supported by subjects’ self-reports where they showed an increase in acceptance of rape myths, willingness to use force and admit they would commit rape if not caught. Donnerstein (1983 B). Such results show a strong correlation between exposure to violent pornography and violence against women. 

The previous experiment has shown the result of a single exposure to violent content. Thereby it will be interesting to look at the effect of long term exposure to aggressive content, for example, violence in media. Berkowitz created a series of experiments to study the effect of observing filmed violence. First, the male subject is paired with the confederate while working on an intelligence test. Confederate insults a subject. The next task is to watch a short violent video. Half of the subjects watch a video where the protagonist receives a harsh beating and is portrayed as an “evil guy” who deserves punishment. The other half of the subjects viewed a video where they felt more sympathetic towards the victim of violence. Then participants watch another violent video of a man getting beaten. Afterwards, subjects have been told to judge the work of their co-worker and give one electric shock if they find the job is decent or more shocks if the job is done poorly. The results showed men who saw the justification of violence acted more aggressive towards their co-workers. (1964)

In conclusion, scientific studies on aggression established the effect of violent sexual and non-sexual media on men’s behaviour and social attitudes against women and men. 

References

Berkowitz, l., 1964. The Effects of Observing Violence. Scientific American, Vol. 210(2), 313-324. https://citeseerx.ist.psu.edu/viewdoc/download?doi=10.1.1.526.5954&rep=rep1&type=pdf

Bernstein, D., 2016. Psychology: Foundations and Frontiers. Cengage Learning. 

Donnerstein, E., Malamuth, N., 1984. Pornography and sexual aggression. Academic press. https://bunker4.zlibcdn.com/dtoken/93388e19fb1a66f8aad9cad2323c7f79

Donnerstein, E., & Berkowitz, L. (1981). Victim reactions in aggressive erotic films as a factor in

violence against women. Journal of Personality and Social Psychology, 41, Ί10-124. 

Leave a comment

Part 4. Relevant Research on the IAT & Conclusion.

While there have been mixed results regarding the predictive validity of the IAT, some studies have shown that the test is a reliable measure of implicit attitudes. For example, Nosek et al. (2007) found that the IAT was able to predict voting behaviour better than self- report measures, suggesting that the test may be useful in certain contexts. Similarly, Axt et al. (2014) found that the IAT was able to predict discriminatory behaviour in a hiring scenario, suggesting that the test may be useful in identifying implicit biases in the workplace.

However, it is important to note that the IAT is not without its limitations. As mentioned earlier, the test has been criticised for its low test-retest reliability, which can limit its usefulness in longitudinal studies or when measuring changes in attitudes over time (Oswald et al., 2013). Additionally, there is some debate about the extent to which the IAT measures true implicit attitudes, as the test may also reflect explicit attitudes or other factors such as response bias (Hofmann et al., 2005).
Despite these limitations, the IAT remains a widely used tool for assessing implicit attitudes, and it has been used in a variety of fields, including psychology, sociology, and political science (Greenwald et al., 2003). As with any measure, it is important to consider the strengths and weaknesses of the IAT in light of the specific research question and context.

Recommendation:

Based on the available evidence, it is recommended that the implementation of the Implicit Association Test (IAT) should be considered for broader use across the country to promote diversity and inclusion.
Studies have shown that the IAT is a reliable and valid tool for assessing implicit attitudes and biases related to race, gender, and sexual orientation (Greenwald et al., 1998; Nosek et al., 2002). Furthermore, research has demonstrated that implicit biases can have significant negative effects on decision-making, behaviour, and outcomes in a variety of settings, including healthcare, education, and the workplace (FitzGerald & Hurst, 2017; Hall et al., 2015; Greenwald et al., 2009).

Using the IAT in combination with other measures can provide a more comprehensive understanding of the issues being studied. For example, in healthcare settings, the IAT can be used in conjunction with clinical observations and patient feedback to assess the impact of implicit biases on healthcare outcomes (FitzGerald & Hurst, 2017).
In conclusion, based on the available evidence, the implementation of the IAT should be considered for broader use across the country as part of efforts to promote diversity and inclusion. However, its limitations should be recognized, and its results should not be the sole basis for making decisions about individuals or groups. Its use should be in conjunction with other measures of attitudes and behaviours. Additionally, interventions aimed at reducing implicit biases should be designed to incorporate observational learning and modelling behaviours that promote positive attitudes towards stigmatized groups.

  • References:
  • Axt, J. R., Ebersole, C. R., & Nosek, B. A. (2014). The rules of implicit evaluation by race, religion, and age. Psychological science25(9), 1804–1815. https://doi.org/10.1177/0956797614543801
  • Bandura, A. (1977). Social learning theory. Englewood Cliffs, NJ: Prentice-Hall. https://doi.org/10.1177/105960117700200317
  • Blair, I. V., Steiner, J. F., Hanratty, R., Price, D. W., Fairclough, D. L., Daugherty, S. L., Bronsert, M., Magid, D. J., & Havranek, E. P. (2014). An investigation of associations between clinicians’ ethnic or racial bias and hypertension treatment, medication adherence and blood pressure control. Journal of General Internal Medicine29(7), 987-95. https://doi.org/10.1007/s11606-014-2795-z
  • Blanton, H., Jaccard, J., Strauts, E., Mitchell, G., & Tetlock, P. E. (2015). Toward a meaningful metric of implicit prejudice. The Journal of applied psychology100(5), 1468–1481. https://doi.org/10.1037/a0038379
  • Cooper, J., Blackman, S., & Keller, K. (2015). The Science of Attitudes. Taylor & Francis.https://essexonline.vitalsource.com/books/9781317509615
  • Dasgupta, N., & Asgari, S. (2004). Seeing is believing: Exposure to counterstereotypic women leaders and its effect on the malleability of automatic gender stereotyping.
  • Journal of Experimental Social Psychology, 40(5), 642-658. https://psycnet.apa.org/doi/10.1016/j.jesp.2004.02.003
  • Devine, P. G. (1989). Stereotypes and prejudice: Their automatic and controlled components. Journal of personality and social psychology, 56(1), 5-18. DOI: 10.1037//0022- 3514.56.1.5
  • Devine, P. G., Forscher, P. S., Austin, A. J., & Cox, W. T. (2012). Long-term reduction in implicit race bias: A prejudice habit-breaking intervention. Journal of experimental social psychology48(6), 1267–1278. https://doi.org/10.1016/j.jesp.2012.06.003
  • FitzGerald, C., Hurst, S. (2017) Implicit bias in healthcare professionals: a systematic review.BMC Med Ethics 18, 19. https://doi.org/10.1186/s12910-017-0179-8
  • Greenwald, A. G., McGhee, D. E., & Schwartz, J. L. K. (1998). Measuring individual differences in implicit cognition: The implicit association test. Journal of Personality and Social Psychology, 74(6), 1464–1480. https://doi.org/10.1037/0022- 3514.74.6.1464
  • Greenwald, A. G., Banaji, M. R., Rudman, L. A., Farnham, S. D., Nosek, B. A., & Mellott, D. S. (2002). A unified theory of implicit attitudes, stereotypes, self-esteem, and self- concept_. Psychological Review, 109_(1), 3-25. DOI: 10.1037//0033-295X.109.1.3
  • Greenwald, A. G., Poehlman, T. A., Uhlmann, E. L., & Banaji, M. R. (2009). Understanding and using the implicit association test: III. Meta-analysis of predictive validity. Journal of Personality and Social Psychology, 97(1), 17–41.https://doi.org/10.1037/a0015575
  • Greenwald, A. G., Nosek, B. A., & Banaji, M. R. (2003). Understanding and using the implicit association test: I. An improved scoring algorithm. Journal of personality and social psychology85(2), 197–216. https://doi.org/10.1037/0022-3514.85.2.197
  • Hall, W. J., Chapman, M. V., Lee, K. M., Merino, Y. M., Thomas, T. W., Payne, B. K., Eng, E., Day, S. H., Coyne-Beasley, T., & Coa, K. (2015). Implicit racial/ethnic bias among health care professionals and its influence on health care outcomes: A systematic review. American Journal of Public Health, 105(12), 60-76. doi: 10.2105/AJPH.2015.302903
  • Hofmann, W., Gawronski, B., Gschwendner, T., Le, H., & Schmitt, M. (2005). A meta- analysis on the correlation between the Implicit Association Test and explicit self- report measures. Personality and Social Psychology Bulletin, 31(10), 1369-1385. doi: 10.1177/0146167205275613
  • Kang, Y., Gray, J. R., & Dovidio, J. F. (2014). The nondiscriminating heart: lovingkindness meditation training decreases implicit intergroup bias. Journal of experimental psychology. General143(3), 1306–1313. https://doi.org/10.1037/a0034150
  • Lu, H. J., Chang, L., & Li, Y. (2017). Does the Implicit Association Test (IAT) really measure implicit attitudes? A comparative test of the IAT and explicit measures. Personality and Social Psychology Bulletin, 43(5), 559-569.
  • Nosek, B. A., Banaji, M. R., & Greenwald, A. G. (2002). Harvesting implicit group attitudes and beliefs from a demonstration website_. Group Dynamics: Theory, Research, and Practice, 6_(1), 101–115. https://doi.org/10.1037/1089-2699.6.1.101
  • Nosek, B. A., Greenwald, A. G., & Banaji, M. R. (2007). The Implicit Association Test at age 7: A methodological and conceptual review. In J. A. Bargh (Ed_.), Social psychology and the unconscious: The automaticity of higher mental processes_ (pp. 265–292). Psychology Press.https://faculty.washington.edu/agg/pdf/Nosek%20&%20al.IATatage7.2007.pdf
  • Okonofua, J. A., Walton, G. M., & Eberhardt, J. L. (2016). A vicious cycle: A social– psychological account of extreme racial disparities in school discipline. Perspectives on Psychological Science, 11(3), 381-398. https://psycnet.apa.org/doi/10.1177/1745691616635592
  • Olson, M. A., & Fazio, R. H. (2009). Implicit and explicit measures of attitudes: The perspective of the MODE model. In R. E. Petty, R. H. Fazio, & P. Brinol (Eds.), Attitudes: Insights from the new implicit measures (pp. 19-63). New York, NY: Psychology Press. https://shorturl.at/mIJT8
  • Oswald, F. L., Mitchell, G., Blanton, H., Jaccard, J., & Tetlock, P. E. (2013). Predicting ethnic and racial discrimination: A meta-analysis of IAT criterion studies. Journal of Personality and Social Psychology, 105(2), 171–192. https://psycnet.apa.org/doi/10.1037/a0032734
  • Rudman, L. A., & Phelan, J. E. (2010). The interpersonal power of feminism: Is feminism good for romantic relationships? Sex Roles, 62(3-4), 197-207. DOI:10.1007/s11199- 007-9319-9

Leave a comment

Part 3. Can we detect Social Biases?

Pros and Cons of Using the IAT:

One advantage of using the IAT is that it is less susceptible to social desirability biases, as it measures implicit attitudes that are often outside of an individual’s conscious awareness (Nosek et al., 2002). This is important because people may not always be willing or able to report their true attitudes, especially if they are concerned about how others may perceive them. By measuring implicit attitudes, the IAT can provide a more accurate picture of an individual’s attitudes and beliefs.

Additionally, the IAT can be administered remotely and quickly, making it a relatively low- cost and efficient tool for assessing attitudes. This is particularly useful in large-scale research studies, where researchers may need to assess the attitudes of many participants in a short period of time. The IAT can be administered online, which also allows researchers to reach a more diverse pool of participants than they might be able to through in-person testing (Greenwald et al., 1998).
There are two additional advantages of using the IAT are its ability to identify unconscious biases and its potential for identifying the underlying mechanisms of biases in social-cultural contexts.
Firstly, the IAT is able to identify unconscious biases that individuals may not even be aware of, which can be particularly valuable in identifying and addressing systemic biases in social- cultural contexts. Unconscious biases can have a significant impact on social interactions, decision-making processes, and behaviors, which can perpetuate inequalities in society (Devine, 1989). By identifying these biases, the IAT can serve as a starting point for individuals and organizations to address and correct them (Kang et al., 2014).
Secondly, the IAT has the potential to identify the underlying mechanisms of biases in social- cultural contexts. For example, research has used the IAT to explore the impact of social norms on implicit attitudes towards stigmatized groups (Rudman & Phelan, 2010). This research has found that individuals may hold implicit biases even if they consciously endorse egalitarian beliefs, which suggests that social norms may play a significant role in shaping implicit attitudes. By identifying the underlying mechanisms of biases, the IAT can provide insight into the complex processes that contribute to social inequalities and inform interventions to address them.

However, the IAT has also been criticized for its limited ability to predict behaviour. This is because the test only measures automatic associations, which may not always translate into real-world behaviour (Greenwald et al., 2002). In other words, just because someone has an implicit bias on the IAT does not necessarily mean that they will behave in a biased way in real life.

Furthermore, the IAT has been shown to have low test-retest reliability, indicating that an individual’s scores on the test may vary over time (Oswald et al., 2013). This is an important consideration for researchers who may be using the IAT to track changes in attitudes over time or to evaluate the effectiveness of interventions aimed at reducing bias. Low test-retest reliability suggests that the IAT may not be a reliable tool for measuring changes in attitudes over time.

Another potential disadvantage of the IAT is that it may not always be culturally appropriate or relevant for certain populations. For example, some studies have found that the IAT may not accurately capture implicit attitudes among individuals from non-Western cultures (Lu et. al., 2017). This may be because the test was developed and normed using Western samples, and the underlying assumptions and associations may not be universally applicable.
On the other hand, one potential benefit of the IAT is that it can provide feedback to individuals about their own biases, which can be a useful tool for personal growth and development (Blanton et al., 2015). This can be particularly valuable in contexts such as education and training, where individuals may be motivated to change their attitudes and behaviours.

In summary, the IAT has both advantages and limitations as a tool for assessing implicit attitudes. While it can provide a more accurate picture of an individual’s attitudes and beliefs, it may not always be culturally appropriate or relevant, and may not reliably predict behaviour or changes in attitudes over time. Researchers and practitioners should carefully consider the strengths and weaknesses of the IAT when deciding whether to use it in their research or practice.

Part 2. Can we detect Social Biases?

Social learning theory and its role in the issue:

One theory of attitude formation and change that is relevant to the discussion on the IAT is the social learning theory. Social learning theory suggests that attitudes can be acquired through direct experience, observation of others’ behaviours, and through the influence of media and cultural norms (Bandura, 1977). This theory posits that attitudes can change through the process of observational learning, where an individual learns from the consequences of others’ behaviours.

In the context of the IAT, social learning theory suggests that implicit attitudes may be influenced by exposure to biased media representations or cultural norms that perpetuate stereotypes and prejudice. For example, an individual who is repeatedly exposed to negative stereotypes of a particular racial or ethnic group in the media may develop implicit biases towards that group, even if they consciously reject those stereotypes (Olson & Fazio, 2009). Moreover, social learning theory also suggests that attitudes can be changed through the process of modelling. This means that individuals can learn new attitudes by observing the behaviours of others and the consequences of those behaviours (Bandura, 1977). Therefore, interventions aimed at reducing implicit biases, such as the IAT, may be more effective if they incorporate modelling behaviours that promote positive attitudes towards stigmatized groups. For example, research has shown that exposure to positive counter-stereotypical exemplars (Dasgupta & Asgari, 2004) as well as diversity training program (Devine et al., 2012) can lead to a reduction in implicit biases towards various social groups. Overall, the social learning theory provides a useful framework for understanding how implicit attitudes are formed and changed, and highlights the importance of environmental factors in shaping attitudes.

Can we detect Social Biases?

Introduction

Attitudes are a fundamental aspect of human behaviour, and they can shape our thoughts, feelings, and actions towards different stimuli. It is a well-established fact that attitudes can be explicit or implicit. Explicit attitudes are consciously held and often expressed through self-report measures, while implicit attitudes are unconscious and automatic, making them challenging to measure using traditional self-report methods (Cooper et al., 2015). This series of blog-posts will critically review the implementation of the Implicit Association Test (IAT) as a tool for assessing attitudes, with reference to relevant theory and research. Additionally, an evidence- based recommendation will be made about whether this practice should be rolled out across the whole country.

What is the Implicit Association Test (IAT)?

The Implicit Association Test (IAT) is a widely-used measure of implicit attitudes and associations, particularly those related to social and racial biases. Developed by Greenwald, McGhee, and Schwartz in 1998, the IAT measures the strength of an individual’s automatic association between mental representations of objects in memory by measuring reaction times to categorize stimuli into various categories. The IAT has been used to investigate various implicit biases, such as those related to race, gender, sexual orientation, and age.
For example, studies using the IAT have found evidence of implicit biases against Black individuals in various domains, including healthcare, education, and criminal justice. One study found that medical professionals who scored higher on the IAT for implicit bias against Black individuals were less likely to recommend thrombolysis (a clot-busting drug) to Black patients with acute coronary syndrome than to White patients with the same condition (Blair et al., 2014). In education, studies have found that implicit biases can affect teachers’ expectations and perceptions of students, leading to differential treatment and outcomes. For instance, teachers who scored higher on the IAT for implicit bias against Black individuals were more likely to rate Black students’ behaviour as problematic and to recommend disciplinary action than White students with the same behaviour (Okonofua et al., 2016).